As Google Analytics is approaching its 15th anniversary, Webspec is looking back and appreciating how much data this tool provides (for free!). When Google Analytics is installed right out of the box, it gives amazing insights into your website traffic and interaction. It gives you easy access to data on sessions, unique visitors, most popular pages, average time on site, as well as the acquisition channel that users are coming from, among much else. However, Google Analytics can be even more insightful if you “activate” certain capabilities that aren’t turned on right out-of-the box. Below, we will highlight a few of those additional Google Analytics capabilities:
Enable Demographics and Interests Reports in Google Analytics
One of the quickest and easiest ways to level up your Google Analytics is by enabling the demographics and interest reports. These sections will break out your site visitors into age & gender groups, so that you can have more insight into who visits your website. By default, these are not turned on, since you may want to update your privacy policy before collecting the data, but can be enabled by selecting the blue ‘Enable’ button on the Audience > Demographics > Overview page or Audience > Interests > Overview page.
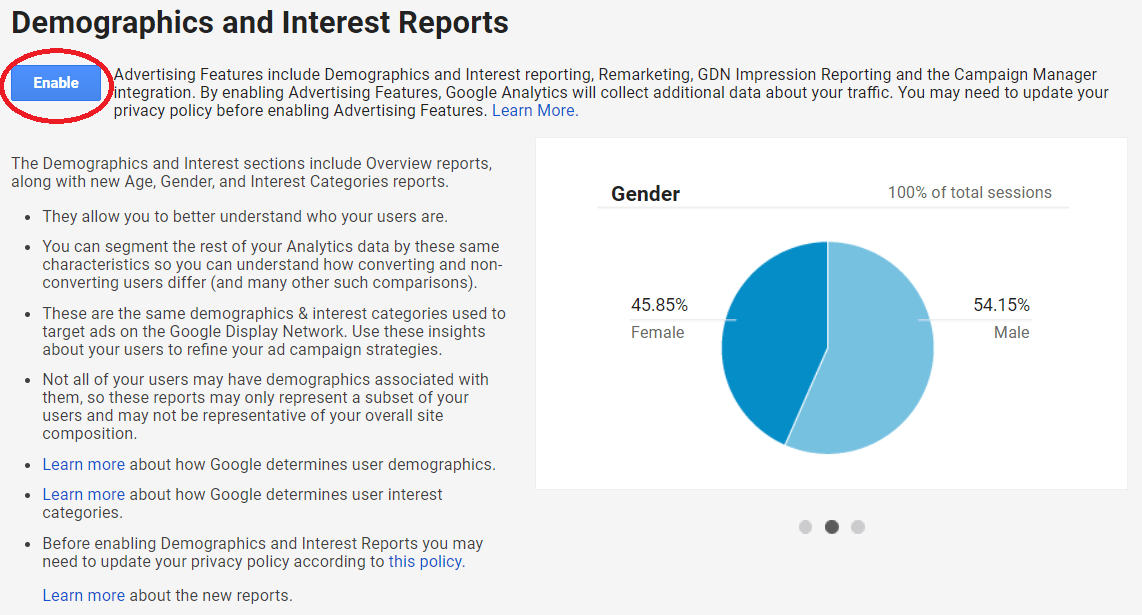
Once enabled, Google will group your users into categories and groups that help you understand how converting and non-converting users differ. You might recognize that most of your site users who end up completing a purchase are males between 25 and 30, for example. These are the same demographics & interest categories used to target ads on the Google Display Network, so if you’re running Google Ads, this may be very insightful information.
It should be noted, however, that not all of your users will allow their demographic or interest data to be collected. Depending on the browsers or devices they use or the privacy settings they’ve set, many people may opt-out. Typically, the demographics and interest reports will represent a 25%-40% subset of your website visitors.
More on Demographics
We all make assumptions about who our “average” customer is, and how they find out about you, but what if there was data to back up those assumptions? With Google Analytics, you can see if your gut feeling is correct. Once enabled and tracking, the demographics information will give a breakdown of the age range and gender of your website visitors.
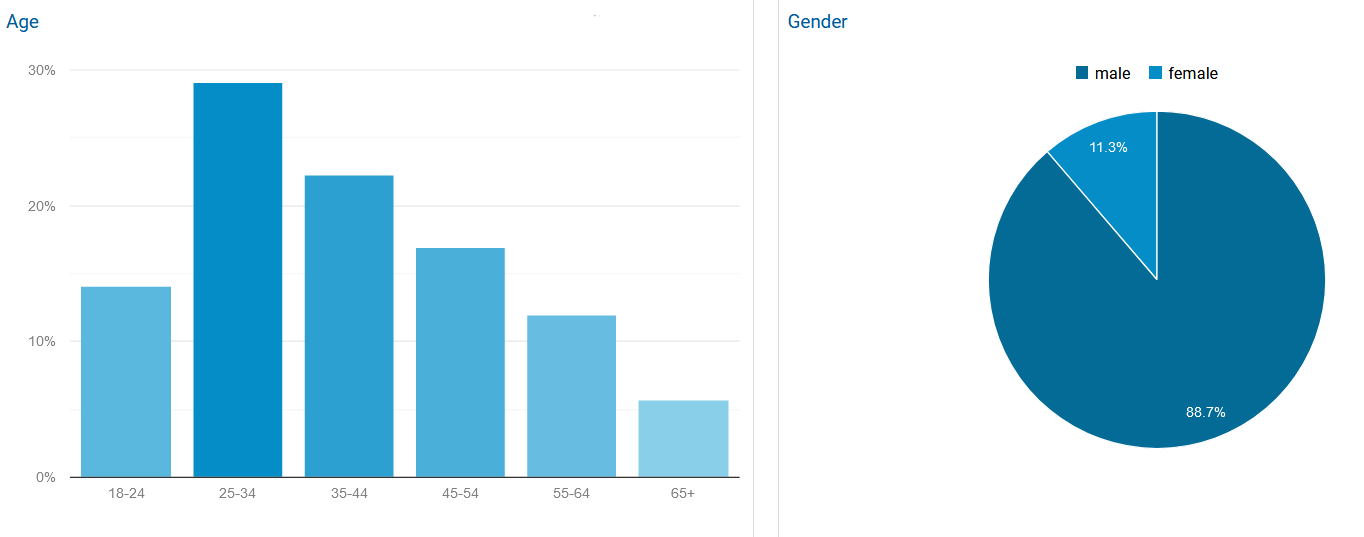
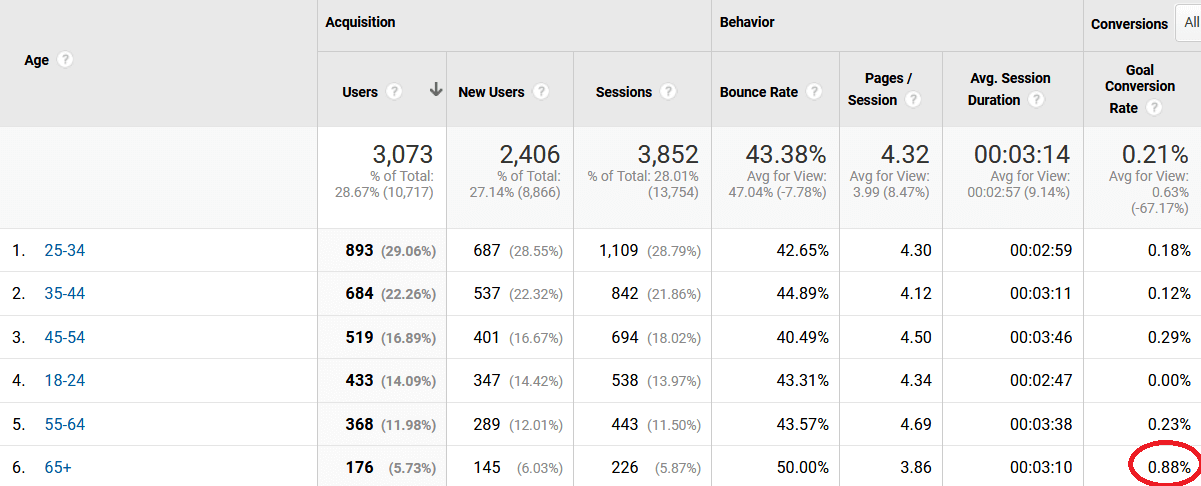
While you may not be completely shocked by this data, there are still some interesting insights you can collect here. For example, you can dive into the details and compare the avg. session duration, bounce rate, or goal completion rate by each demographic. For example, below, you’ll see that despite the age group of 65+ having the fewest website visitors, their goal completion rate is the highest. Perhaps this website owner should be doing more to attract customers 65+.
More on Interests
Similar to the demographics report, the interests reports will tell you various affinity categories or in-market segments that your website visitors belong to. The term Affinity Category indicates various user segments that Google has identified that visitors belong in who share similar interests and common traits. These categories can be utilized in targeting for Google Ads as well.
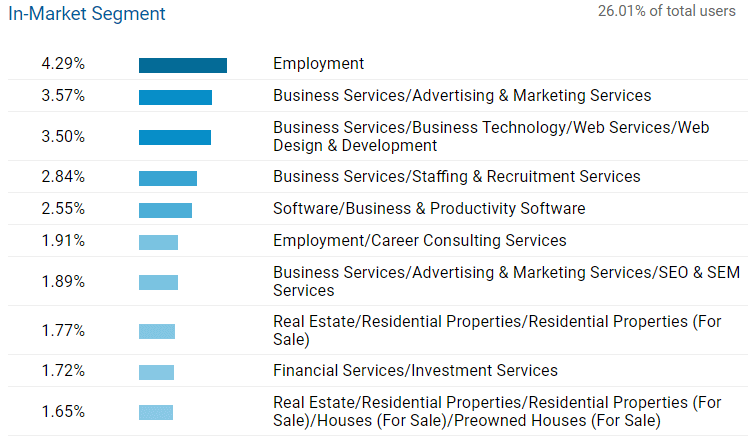
In-Market Segments are similar to affinity categories, but they speak more about what your visitors are in the market of purchasing, based on Google’s search history of the visitor. These categories can serve you extremely well when targeting with display advertisements – keeping your brand top-of-mind to potential customers. As with the demographics data, you can layer in other data points such as bounce rate, landing pages, and conversion rates for all of these categories. If this is something you’d like to explore further, Webspec’s Digital Marketing team loves data and can help you double-click into your demographics and interests reports.
Add Custom Views in Google Analytics
Another great way to take your Google Analytics to the next level is by creating additional views. Each analytics property may set up to 25 views, which can track or filter out specific data. By default, when you set up an analytics account, you have one view set, which tracks All Website Data.
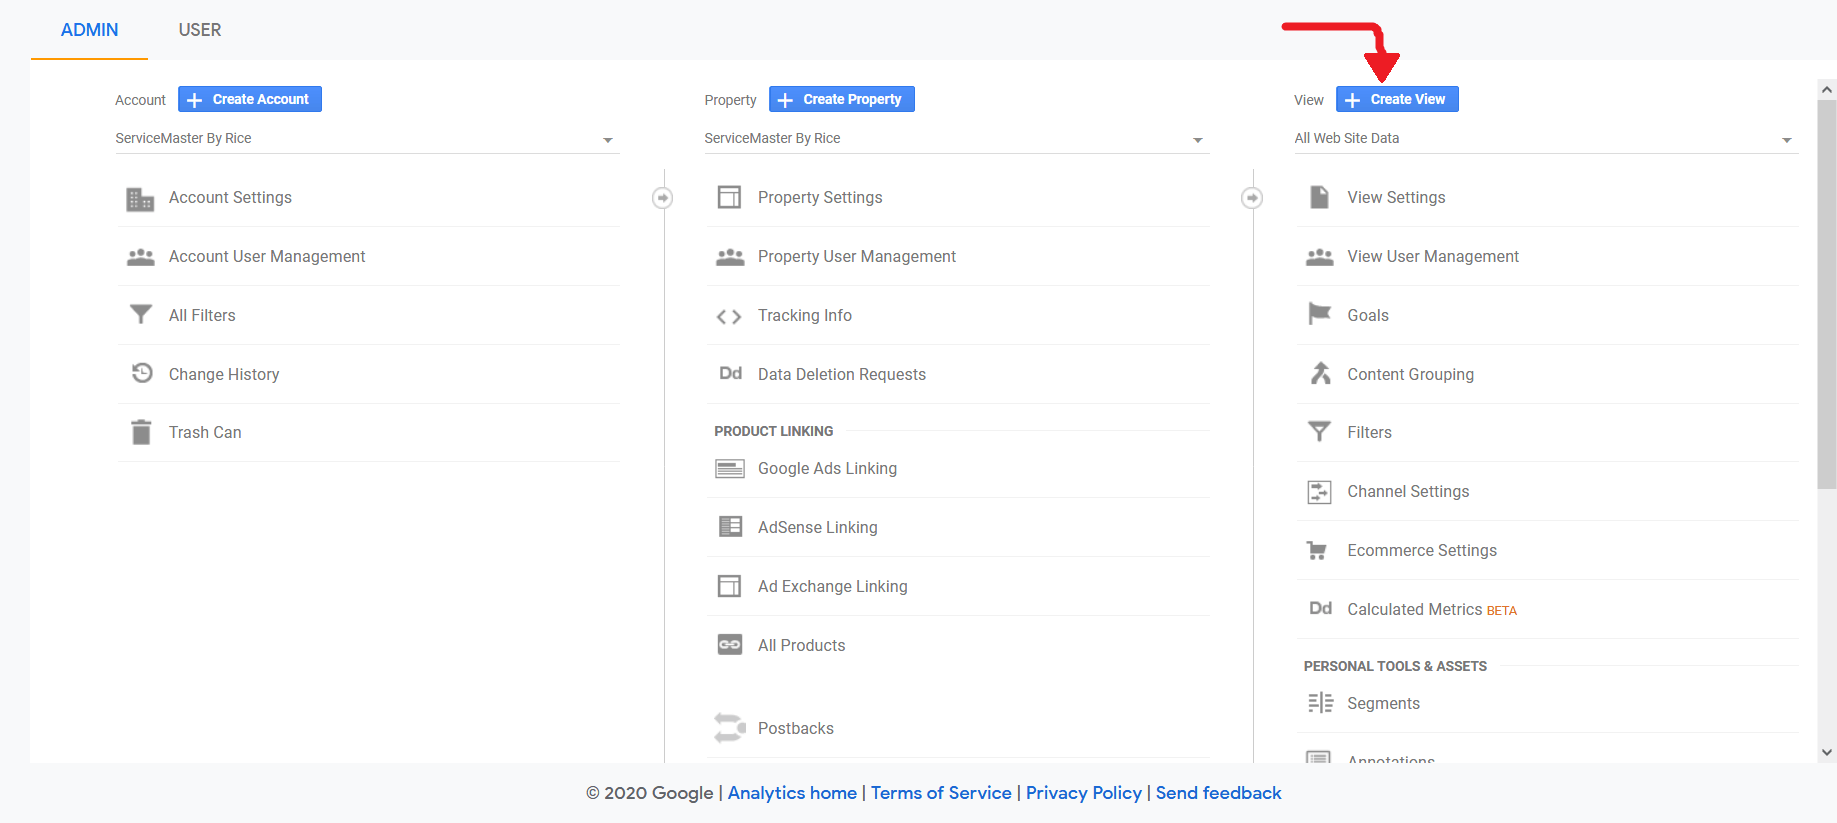
It’s nice to see all of your aggregate data in one view, but what if you want to have different data sets that show a subset of your site traffic? For example, you can create a separate view for:
- Filtering out all known bots
- Filtering site traffic from known data centers
- Filtering out internal traffic from your own employees
- Showing paid-only or non-paid traffic
- Showing traffic from one specific state or country
- Show traffic only from specific campaigns or sources
You set these views by creating filters in each view to ‘include only’ specific traffic, or to ‘exclude’ traffic you don’t want to see.
Enable Site Search Reporting
An important feature for many websites is their robust site search functionality. This allows users to search for a topic on your website and makes your content more quickly accessible to them. While some websites do not have a search functionality, it’s important to track the search queries for those that do. This will allow you to see what people are searching for, and allow you to make informed decisions based on those search results. You may also discover new insights into user behavior about your website that you previously would have never known.
To enable site search reporting in your Google Analytics account, navigate to the Settings section of the view, click ‘View Settings,’ and scroll down to the ‘Site Search Settings’ area. Here, you can enable site search reporting. You will have to put in your search query parameter, which will often be something like “q” or “s.” Depending on how your website was set up, and how the search functionality was coded, the search query may be different from site to site. To learn more about enabling site search reporting, visit Google’s help section.
Set Up Event Tracking
One of the most powerful tools you can employ in your Google Analytics account is event tracking—events are specific interactions done by visitors where they may click on or do something on your site. By default, websites are not set up to send events or track user behavior, but with a little coding help, you’ll be able to not just see how many people come to your site from what sources, but also be able to track how many times they perform valuable actions once there.
Events can be set up to track almost any action on your website. For example, you can tag your website to send an event to Google Analytics any time somebody submits a contact form, clicks a button, or calls you from your site. While there is some slight coding involved with setting up event tracking, the change typically only needs to happen once, and then your website will be tracking events continually going forward.
Some common events to track on your website include:
- Contact form submissions
- Click-to-call or click-to-email actions
- External link clicks
- CTA button clicks
- Video views
- Time on page events
- Scroll depth
If you’re curious about what your website visitors do once they land on your page, you may want to set up event tracking. Give us a call to schedule a consultation today.
Create Goals & Conversions From Events
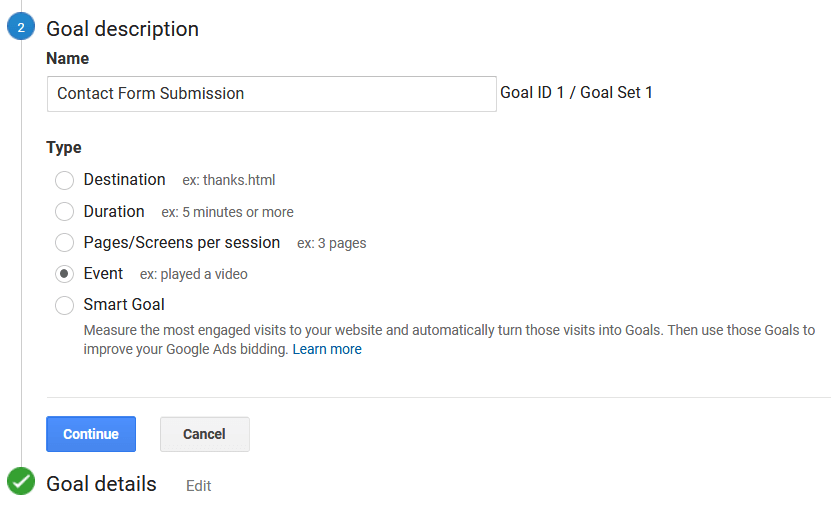
Once you have events created that are tracking in Google Analytics, you can easily set up goals based on these events. Goals turn events into “conversions” In order to do this, navigate in your account to the Settings page, and then click ‘Goals’ under the View column. Here, you can click the red button to create new goals.
Setting up goes from events is very straightforward; select the ‘Custom’ category of goal, name it, and then choose ‘Event’ as the type. After that, you simply put in the event’s category, action and/or label, to select what event(s) you want to craft this goal from. Depending on how specific your events are, you can either get very granular with the goals, or keep them very broad—that’s up to you.
Assign a Monetary Value to Your Goal Conversions
 Something worth noting is that before you save your goal, you can also assign a monetary value to it. You can either have this trigger individually for every single event, which may be helpful with e-commerce stores where the checkout value may vary, or you can select an average value per conversion. In many cases, such as calls or contact form submissions, it’s best to work backwards and calculate what your average sale is worth, then determine what your close rate on each lead is, in order to figure out what a single lead is worth on average.
Integration with Google Ads & Google Search Console
One of the great things about running your website analytics through Google is that it integrates with many other Google platforms. This allows you to import and cross-analyze data in platforms such as Google Ads and Google Search Console.
For Google Ads this is especially useful, because you can import conversions from Analytics into your ads platforms, you can share custom audiences, and you can analyze the website performance of people who have clicked on your ads.
For Google Search Console, it opens up more of the organic traffic, rankings, and search queries and pulls them into Google ads in a way that you’re unable to without integrating them.
Create Custom Audiences
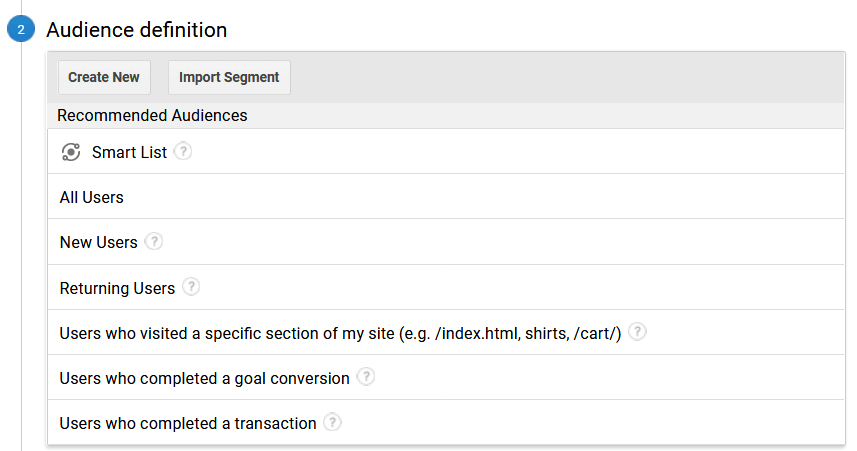
As mentioned above, you can create custom audiences in Google Analytics. These audiences can then easily be published to platforms such as Google Ads. In order to create audiences, navigate to the Audience Definitions section for the property on the Analytics settings page. Once there, you can set up your first audience group as “All Users.”
The power of audiences comes once you set up multiple for different target audiences. For example, you can set up different audiences for each service you provide. That way, you can group people together based on what content on your website they viewed. From those, you can then run remarketing ads that are more specific to their needs or interests, because you know that they visited a key page.
Additionally, for e-commerce, you’re able to set up audiences for people who have added items to the cart, but have not checked out. That can be a major converting audience, because you know that they’re only one step away from purchasing.
Integrate Your E-Commerce Data
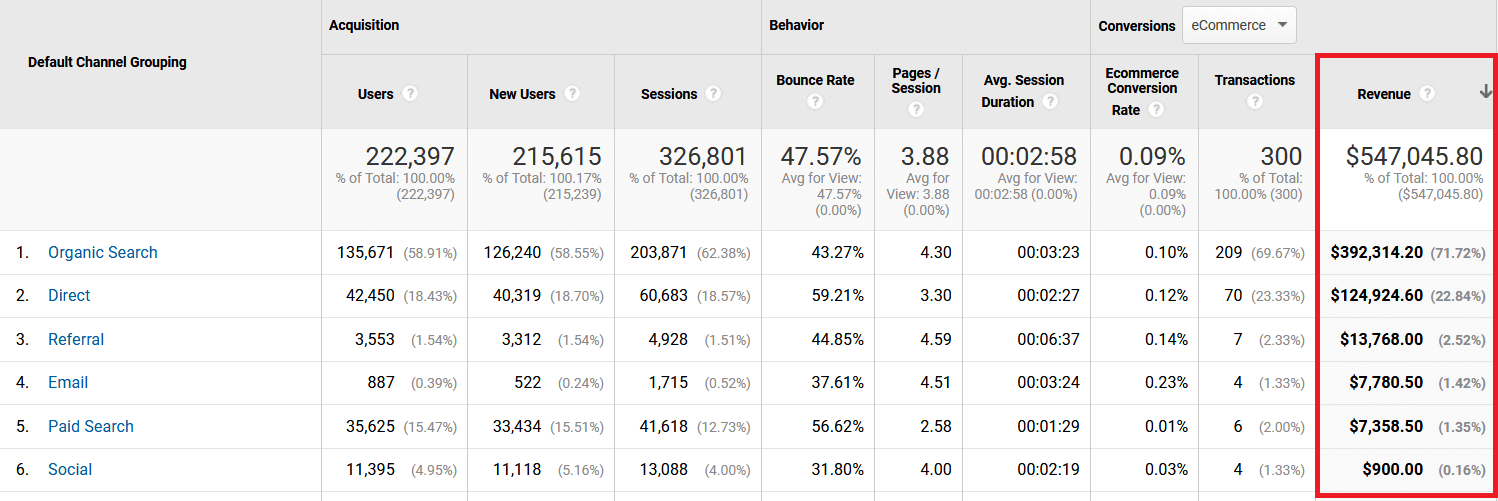
Along with audiences, if you do have an e-commerce website, it’s important to integrate your sales data with Google Analytics. The reason for this is because you will then be able to see more specifically how much revenue each user group is generating i.e. you can see how it interacts with all the other metrics in Google Analytics. For example, you will be able to see what acquisition channel generates the most revenue, you can see how much ROI you’re getting on your ad campaigns, you can see a breakdown of age and gender, etc.
Monitor The Success of Your Campaigns
Similar to e-commerce, you can also see the success breakdown of specific campaigns—not just Google ads, but social media campaigns, newsletters, etc. These are available inside Google Analytics in the Acquisition > Campaigns section.
The important thing to remember with campaigns is to tag them with a utm_campaign URL parameter. These communicate information from your specific campaigns and bring that data into Google Analytics. Some platforms such as Google Ads and Mailchimp allow autotagging, which does much of the work for you. However, if you’re running any campaigns on Facebook, Instagram, Bing, or other platforms, it’s important to remember to tag them yourself. If you’re unsure where to begin with tagging these, Google has a free campaign URL builder tool, which can help you fill in the details. Otherwise, feel free to reach out to Webspec for more information.
Create Custom Dashboards or Reports
Another way to maximize your Google Analytics account is by creating custom dashboards and reports. These allow you to set up certain widgets or reports that automatically pull into an easy-to-read dashboard or a report that can run incrementally. This can be especially useful when sharing data with one of your leaders or managers, so that they can quickly see a rundown of the website’s success.
However, it seems as though Google has been making a push recently to discontinue the use of these sections, and people have begun using Google Data Studio (another free Google product.) The reports you can run using Data Studio are much more extensive and can show a lot more data.
Set Up Custom Alerts
One last recommendation of how to maximize your Google Analytics account is by setting up custom alerts. These can be found in the Settings > Custom Alerts section under the view. Custom alerts are useful if you want to receive an email if your site traffic dips (or spikes) below a certain threshold. Or, they can be set up to show other metrics, such as if organic traffic falls, or if the bounce rate becomes too high. These are only a few examples of custom alerts you can create, but essentially if you want to be notified of any unusual traffic patterns on your website, this is the place to go.
Contact Webspec to Learn More
If you are interested in learning more about how to best optimize your Google Analytics account, don’t hesitate to reach out to Webspec. Our Digital Marketing team members are Google Analytics-certified experts, and would love to help your business or organization maximize its data reporting through this powerful platform. Contact us below: